The pyplot module in matplotlib provide many powerful options for plotting data. However, one of the weaknesses that I have always encountered is that it takes a lot of time to get a plot looking really good. This always requires going back through the code and adjusting the parameters and either adding or removing data from the plots and axes. At times, when there are many of the same plot to generate it is possible to generate a template code that is able to generate all the required figures, however, this still requires manually adjusting all the parameters to get the plot looking good each time.
As a result of this, I decided to build a postprocessor for pyplot that would make the whole process easier. The end result was the pltEditorTool package.
GUI removes the need to manually manipulate the code governing the plots
Just drop the blocks into the page, edit content inline and publish - no technical skills required.
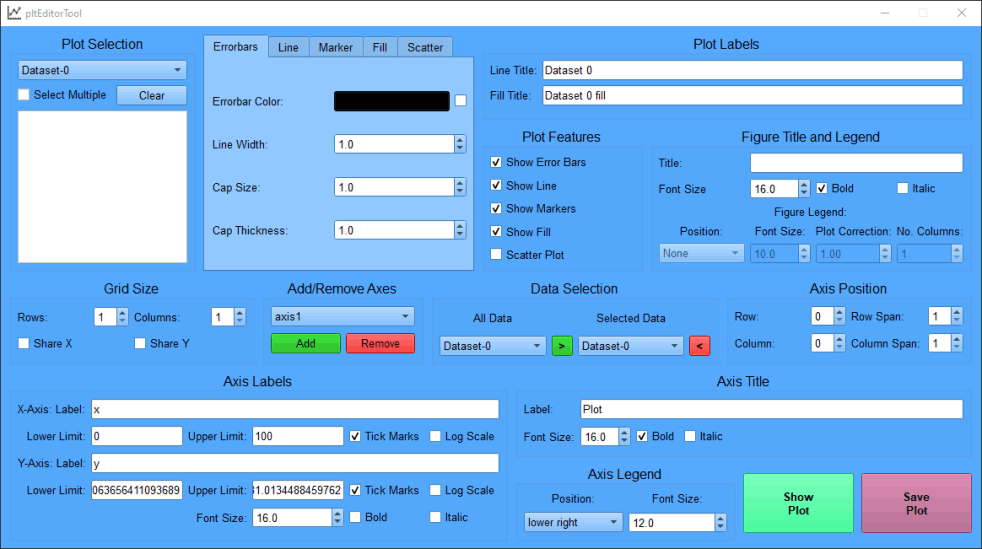
Interface allows for building subplots into the plot by simply adjusting the number of rows and columns required.
Plots can be shown (will show in plots tab of Spyder) or saved. Saving the plot will also save the data and a python script file for replicating the plot
The package is available for download from the Python Package Index and the code is available in a Github repository.
Mobirise website builder - Click for more